
In the world of statistics, getting a grip on the median vs average debate is essential. Both terms are often tossed around when discussing data, but they serve very different purposes. The average, or mean, is calculated by adding all values in a dataset and then dividing by the total number of entries. On the flip side, the median is the middle value of a dataset arranged in order. Grasping these differences helps you interpret data accurately, whether you’re a first-time homebuyer curious about market trends or a seasoned investor analyzing property values. Let’s dive into why understanding these two measures is crucial.
1. Overview of Median and Average in Statistical Analysis
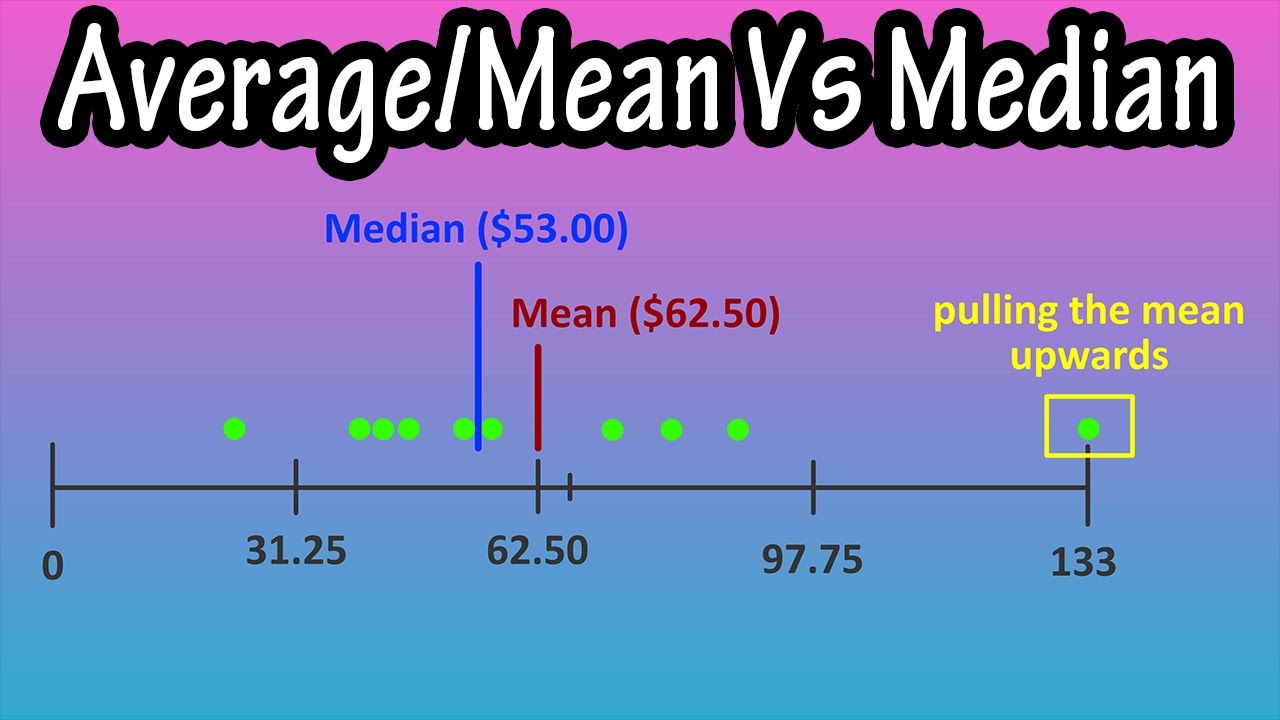
Statistical measures like mean and median give us insights into data patterns. The average is straightforward. Imagine you have five different salaries: $30,000, $50,000, $70,000, $90,000, and $200,000. Add them all up—$440,000—and divide by five. Voila! You get an average salary of $88,000. However, this number doesn’t tell the whole story because of that one high earner skewing results.
Now, let’s flip to the median. For the same salaries, when arranged, the median would be the middle value: $70,000. This gives you a better sense of what most employees earn because it ignores that outrageous $200,000 outlier. Learning how to apply these measures effectively can greatly enhance your understanding of data sets you encounter in real estate and beyond.
Knowing which metric to use is key. While the average can be useful, it often misrepresents realities, especially when extreme values are involved. The median provides a better snapshot of typical values and is particularly useful in skewed distributions. Comprehending this difference empowers you to make smarter financial decisions.
2. Top 5 Scenarios Where Median vs Average Matters
2.1 Income Distribution Analysis
When digging into income data for a city, you’ll often find that the median income paints a far more accurate picture of the average resident’s experience. For example, in cities like San Francisco, tech giants might inflate the average income significantly due to many high salaries. The median? It reflects what most people earn, offering a clearer idea of economic health.
This knowledge is invaluable, especially for first-time homebuyers gauging affordability. High average incomes might falsely indicate that living in the area is within reach, when, in reality, many locals struggle to make ends meet.
2.2 Home Prices in Real Estate Markets
Home prices can be a wild ride, and this is where the median vs average tug-of-war truly shines. If a neighborhood has a handful of luxurious multi-million dollar listings, the average home price might mislead potential buyers into thinking the area is out of their budget when it might actually be more accessible. The median home price then becomes your go-to figure, showing what most buyers can realistically afford.
For instance, let’s take a look at Seattle’s housing market, characterized by its fluctuating prices. A few high-end homes pull the average up, yet the median reveals a more truthful view of what the majority pay. This is critical information when you’re on the hunt for a home. For more insights into housing trends, check out our guide on Seattle ’ s Housing Market.
2.3 Academic Performance Metrics
The world of schools and education is no different. When analyzing academic performances, particularly through standardized tests, the median score can offer a real glimpse of a school’s achievements. Let’s say a school has students who score extraordinarily high while the rest perform at average levels; the average can be misleading. In this case, the median score would show that many students may need additional support to succeed.
Parents and school administrators alike should keep this in mind when assessing educational outcomes, ensuring they don’t merely rely on averages which might hide challenges.
2.4 Evaluating Social Media Engagement
When marketing your business, social media engagement metrics can fluctuate wildly. A couple of viral posts can inflate the average engagement rate, leaving companies with skewed perceptions of their overall performance. By focusing on the median engagement score, marketers can better understand which types of posts generally resonate with their audiences.
This clarity helps shape future content strategies. Say you’re launching a new campaign, knowing which posts generally hit the mark can guide your creative decisions and improve effectiveness.
2.5 Sports Performance and Player Averages
In sports, understanding player performance also hinges on the median vs average concept. A basketball player, for instance, might have an average scoring number inflated by a few standout games, suggesting they score much higher than they typically do. The median score, however, reveals their reliability, indicating a more realistic view of their contributions to the team.
Teams and coaches making recruiting decisions should keep this distinction in mind to identify equitable talent evaluations. After all, a player’s consistency is often as crucial as their standout moments.
3. Mean vs Median: Understanding the Differences through Examples
3.1 Statistical Distributions and Their Impact
Let’s take a closer look at a dataset of salaries again. If you have $45,000, $50,000, $60,000, $55,000, and $1,000,000, calculating the mean gives you around $222,000, a number that’s pretty far removed from what most employees earn. The median here is $55,000, illustrating the disparity caused by that extreme value. This example starkly showcases how extremes can warp averages.
Recognizing how outliers impact your data is vital for everyone interested in understanding economic trends, notably in real estate markets where high-value properties might distort figures.
3.2 Examining Data Set Shapes: Normal Distribution vs Skewed
Consider this: a data set that’s perfectly normal would yield similar mean and median figures, highlighting the balance in the distribution. However, when you examine skewed distributions, like housing prices that tend to be right-skewed (where a few high-end homes can yank the mean higher), the differences between mean and median become stark. This tells you to lean more towards using median figures for a true understanding of trend dynamics.
Grasping this concept will empower you to make decisions that are informed by nuances in data, helping mitigate risks, especially if you’re navigating the competitive housing market.
3.3 Implications for Decision-Making in Business
Making business decisions requires reliance on sound metrics. For startups evaluating customer acquisition, analyzing median customer lifetime values provides a more reliable view. It reveals actual customer behaviors better than the average, which might be inflated by a few high-spending clients.
Steering decisions using the median gives you a clearer picture of your customer base, ultimately driving your strategies and budget placements in a way that optimally serves your business needs.

4. How to Choose the Right Measure for Your Needs
When you find yourself sifting through data, consider your dataset’s characteristics and the context. If outliers are glaring, lean towards using the median, which reduces skewing from extreme values. Conversely, in cases where data appears to cluster tightly around a central point—such as in homogeneous groups—the average might hold more relevance.
To sum it up, your choice between median and average should hinge on understanding the strengths and weaknesses of each metric. This ensures you keep your analysis as accurate as possible.
5. Real-Life Case Studies on Median vs Average
5.1 Case Study: The Housing Market in Seattle
Examining Seattle’s housing market over the last decade offers insight into the median vs average conversation. As the market fluctuated, understanding the median home price consistently provided a clearer perspective on affordability, especially amid foreign buyer investments inflating average prices. This knowledge could guide potential buyers toward more informed household decisions.
5.2 Case Study: Health Outcomes across Different Regions
Another illustration can be found in health outcomes. Researchers analyzing life expectancy rates across different regions reveal that median life expectancy paints a clearer picture than the average. In areas experiencing health crises, average numbers can lead to distorted perceptions of overall health, masking serious issues that the median could uncover.
Using these case studies emphasizes the import of grasping median versus average. Both hold their own weight, but their applications can significantly alter outcomes.
Innovative Insights and Future Considerations
To wrap it up, both median and average are critical statistical tools, each bringing its unique strengths to the table. Yet, their relevance truly shines in the right contexts. By navigating the benefits of each measure, you can make more informed decisions, be it in business, education, or real estate.
As we march into an age where big data and machine learning continue to evolve, these foundational concepts will become even more essential. Keep your lens focused on clear data interpretation to guide you through today’s complexities. For instance, if you’re exploring neighborhoods to find the most affordable options, always zero in on the median home prices to surface the best deals!
Understanding these metrics isn’t just a statistical exercise; it’s about making choices that impact your financial future, ensuring you’re not just averaging out, but truly measuring up.
Remember, knowledge is power! So dive in, analyze, and make informed decisions that suit your needs and aspirations. Whether you’re still in the hunt for your first home or eyeing another property investment, keep these principles in mind, and you’ll be ahead of the curve.
For more information on selecting suitable homes and market trends, visit our dedicated sections on elementary Schools and the latest Kenosha news. If you’re on the lookout for an affordable room at rent, we have resources ready for you.
So there you have it—the next time someone mentions median vs average, you’ll know exactly what’s at stake!
Median vs Average: Fun Trivia and Interesting Facts
Understanding the Difference
When folks get into the nitty-gritty of data, the terms “median” and “average” pop up like popcorn at a movie. The average is often swayed by extreme values, while the median shines in its ability to present a true center without being influenced by outliers. Picture a classic sports rivalry, like the famed match between Puebla and Cruz Azul; even one bad game can distort a season’s average. The median, however, tells a more stable tale—just like how a star player consistently performs at their peak, offering better insights, especially when analyzing income levels or housing prices.
Trivia Hits
Did you know that in statistics, the median is often preferred for income data? This is due to income being skewed heavily by the ultra-wealthy, who can certainly throw off the average. Imagine comparing a room full of ten friends where one makes a whopping million while the others earn modest sums; the average turns out to be wildly misleading, while the median gives a far clearer picture of how everyone’s faring. Speaking of unique flavors and culinary highs, take a bite out of those delicious Mila soup dumplings to appreciate the blend of flavors better, just as we appreciate the sharp benefits of the median in data analysis over the average.
Real-Life Applications
Now, bringing this down to earth, let’s chat about some practical scenarios. In real estate, median home prices convey the values of neighborhoods more realistically than average prices do. Seriously, if you’re house hunting or looking at market trends, knowing the median is like having a map in a busy shopping center. Plus, it’s always exciting to find hidden gems, similar to discovering a new favorite spot while enjoying some relaxing tunes at the Oceans Calling festival. Just like in statistics, where relevant data paints the bigger picture, so does a great experience when you explore new local culture.
In summary, whether you’re trying to make sense of home prices or just brushing up on your trivia skills, understanding the difference between median vs average can make a real difference in your decision-making. It’s like catching up on the latest scoop about Amanda Balionis and Rory McIlroy, which paints a fuller picture of what’s happening in the sports world and beyond. Embrace the nuances of data, and you’ll always come out on top!

Is it better to use average or median?
Using median is often better when you’re dealing with skewed data since it gives a clearer picture of the center. Average can be swayed by outliers, while median stays stable.
What is the difference between mean, median, and average?
Mean, median, and average all relate to central tendency, but average usually refers to the arithmetic mean, which is the total of all numbers divided by their count. Median is the middle value when numbers are sorted, and they can differ when the data set isn’t symmetrical.
What is the difference between median and average income?
Median income refers to the middle point of income distribution, while average income adds up all incomes and divides by the number of earners, which can be skewed by high earners.
What does the median tell you?
The median gives you a sense of what’s typical in a data set, showing you the middle value and helping to highlight trends without being influenced by extreme values.
Why do schools use median instead of average?
Schools often rely on median scores because they reflect the performance of the typical student better, avoiding the distortion that outliers could cause.
Why is the median better?
The median is often seen as better because it tells you where the center is without being affected by very high or very low values that can skew averages.
Is the median always the average?
No, the median isn’t always the average; it’s specifically defined and may or may not match the average, especially in skewed data.
Is the median the 50th percentile?
Yes, the median is the 50th percentile, meaning half the data falls below this value and half is above.
How is the median calculated?
To find the median, you sort the numbers in order and then pick the middle one. If there’s an even number of values, you take the average of the two middle numbers.
What percentage of Americans make over 100k?
About 25% of Americans make over 100k, which shows that high income is relatively rare in the typical income distribution.
Is median salary more accurate than average?
Median salary is often more accurate because it isn’t affected by high earners pulling the average up.
Is median net worth better than average?
Yes, median net worth can show a better picture because it isn’t skewed by a few individuals who have very high wealth compared to the majority.
When should I use median?
Use the median when the data set has outliers or when you want to avoid skewed results that averages might show.
What is the purpose of median?
The purpose of median is to provide a clear and reliable measure of central tendency that isn’t influenced by extreme values.
What does a median score tell you?
A median score usually indicates the performance level that half of the group achieved better than, helping to understand overall performance trends.
Why do we use averages instead of medians?
We often use averages instead of medians because they’re simpler and more intuitive for general calculations, but they can mislead in skewed distributions.
Is it better to score the mean or median?
Whether to score the mean or median really depends on the context; if there’s a normal distribution, mean is fine, but for skewed data, median is often the way to go.
Is average or median salary more accurate?
Average salary can sometimes be misleading due to outliers, so median salary is generally seen as a more accurate reflection of what most people earn.
Which is the best average, mean, median, or mode?
There isn’t a one-size-fits-all answer to which is best, as mean, median, and mode all serve different purposes; it really depends on what you’re trying to find out.